
Module
Cost Tracking
Running costs for vehicles and machinery often pile up out of sight—servicing, fuel, insurance, taxes, tyres, downtime, and leasing fees. Without systematic tracking, a company rarely knows what a vehicle or machine truly costs to operate—or why those costs are increasing.
Kiho’s Cost Tracking Module brings clarity to it all. You can link expenses directly to service task entries or import them in bulk from spreadsheets, then combine that data with mileage and utilisation figures. Kiho automatically calculates accurate €/h and €/km metrics for every vehicle.

Track fleet profitability, not just expenses
Cost tracking is more than an accounting or reporting tool; it’s a practical aid for lifecycle management, pricing and investment decisions. When cost data is tied to driving metrics, you see instantly which machines generate profit and which erode margin. Costs can flow in automatically from service entries or be uploaded in CSV/Excel format. They’re then classified into cost accounts (e.g. diesel, insurance, maintenance) and grouped for clear, comparable reporting. The module brings full transparency and lets you manage by data, not gut feeling.
How Kiho’s Cost Tracking works in practice
1.
Import cost data into the system
Expenses can flow automatically from service logs or be imported in bulk (CSV/Excel). Each expense is tagged to an account such as “diesel” or “leasing” and to a higher‑level cost group like “fuel” or “capital costs”, making comparisons effortless.
Example: The company uploads monthly, vehicle‑specific leasing and fuel costs from Excel. Kiho automatically assigns them to the correct vehicle and cost group, so they appear instantly in cost calculations.
2.
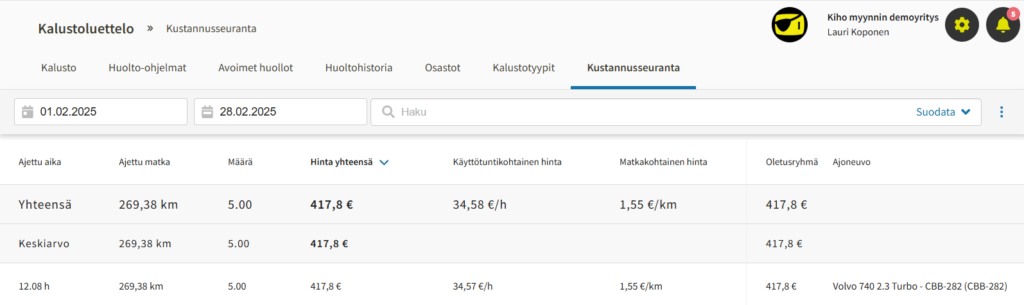
€/km and €/h calculation from drive & usage data
As Kiho records mileage and engine hours, it automatically calculates per‑vehicle costs per kilometre and per hour.
Example: An excavator logs 145 hours in a month. Servicing, fuel and insurance total €3,190, so Kiho shows a utilisation cost of €22/h.
3.
Compare equipment and analyse profitability
Because every machine is treated with the same logic, comparisons are easy. You quickly spot units that generate extra costs, stand idle or drain resources.
Example: Two identical lorries run the same routes, but one’s cost per km is nearly twice as high. Cost tracking reveals repeated repairs and high fuel burn, giving clear grounds to replace the truck.
4.
Cost transparency for customers or internal control
When fleet costs are linked to customer‑ or project‑specific work‑time and task data, you can show true costs to clients or compare unit profitability in‑house.
Example: A civil‑engineering firm compiles a monthly site report that lists not only labour hours but also machine‑specific costs per project, aiding pricing, reporting and continuous improvement.
One view — total cost control
The Cost Tracking Module unlocks a new level of fleet profitability management when connected to the wider Kiho platform. Linking it with Fleet Management attaches costs directly to equipment cards; the Maintenance module adds service and spare‑part costs; Driving Log and Telematics provide precise mileage and utilisation data; and BI Reporting turns the whole picture into actionable analytics. When all cost and usage data is gathered in one place, you can cut unproductive expenses, optimise investments, spot over‑ and under‑used units—and above all, price your work profitably. One Kiho, one view: a powerhouse solution that keeps costs under control.